
The Farm Crisis: Global Problem
In just five years, between the 1996 and 2001 censuses, 12 per cent of Ontario farmers left farming.
By every measure except net income, the Ontario farm economy is booming. Farmers are diversifying into exotic livestock and new crops. Food exports have tripled over the past 15 years. And farmers continue to increase production to keep pace with a global population quickly rising past 6.5 billion people on its way to 10 billion.
But while food production, exports and demand surge, farmers’ prices and profits fall, leaving farm families in crisis. In just five years, between the 1996 and 2001 censuses, 12 per cent of Ontario farmers left farming. That rate of loss will cut in half the number of farms in just a generation.
To solve the farm income crisis, we must understand it, and to do so, we must never lose sight of three facts: the crisis is unprecedented, it is global, and it has been with us for 20 years.
The Crisis
Graph 1 shows that farm production tripled over the past four decades – rising from $50,000 on the average Ontario farm in the mid-1960s to over $150,000 today (all figures adjusted for inflation). Many medium- and large-sized Ontario farms now have gross revenues two or three times that $150,000 figure.
Graph 1. Ontario Farmers’ Gross Revenue from the Markets 1946-2005 (pre-1946 estimates)
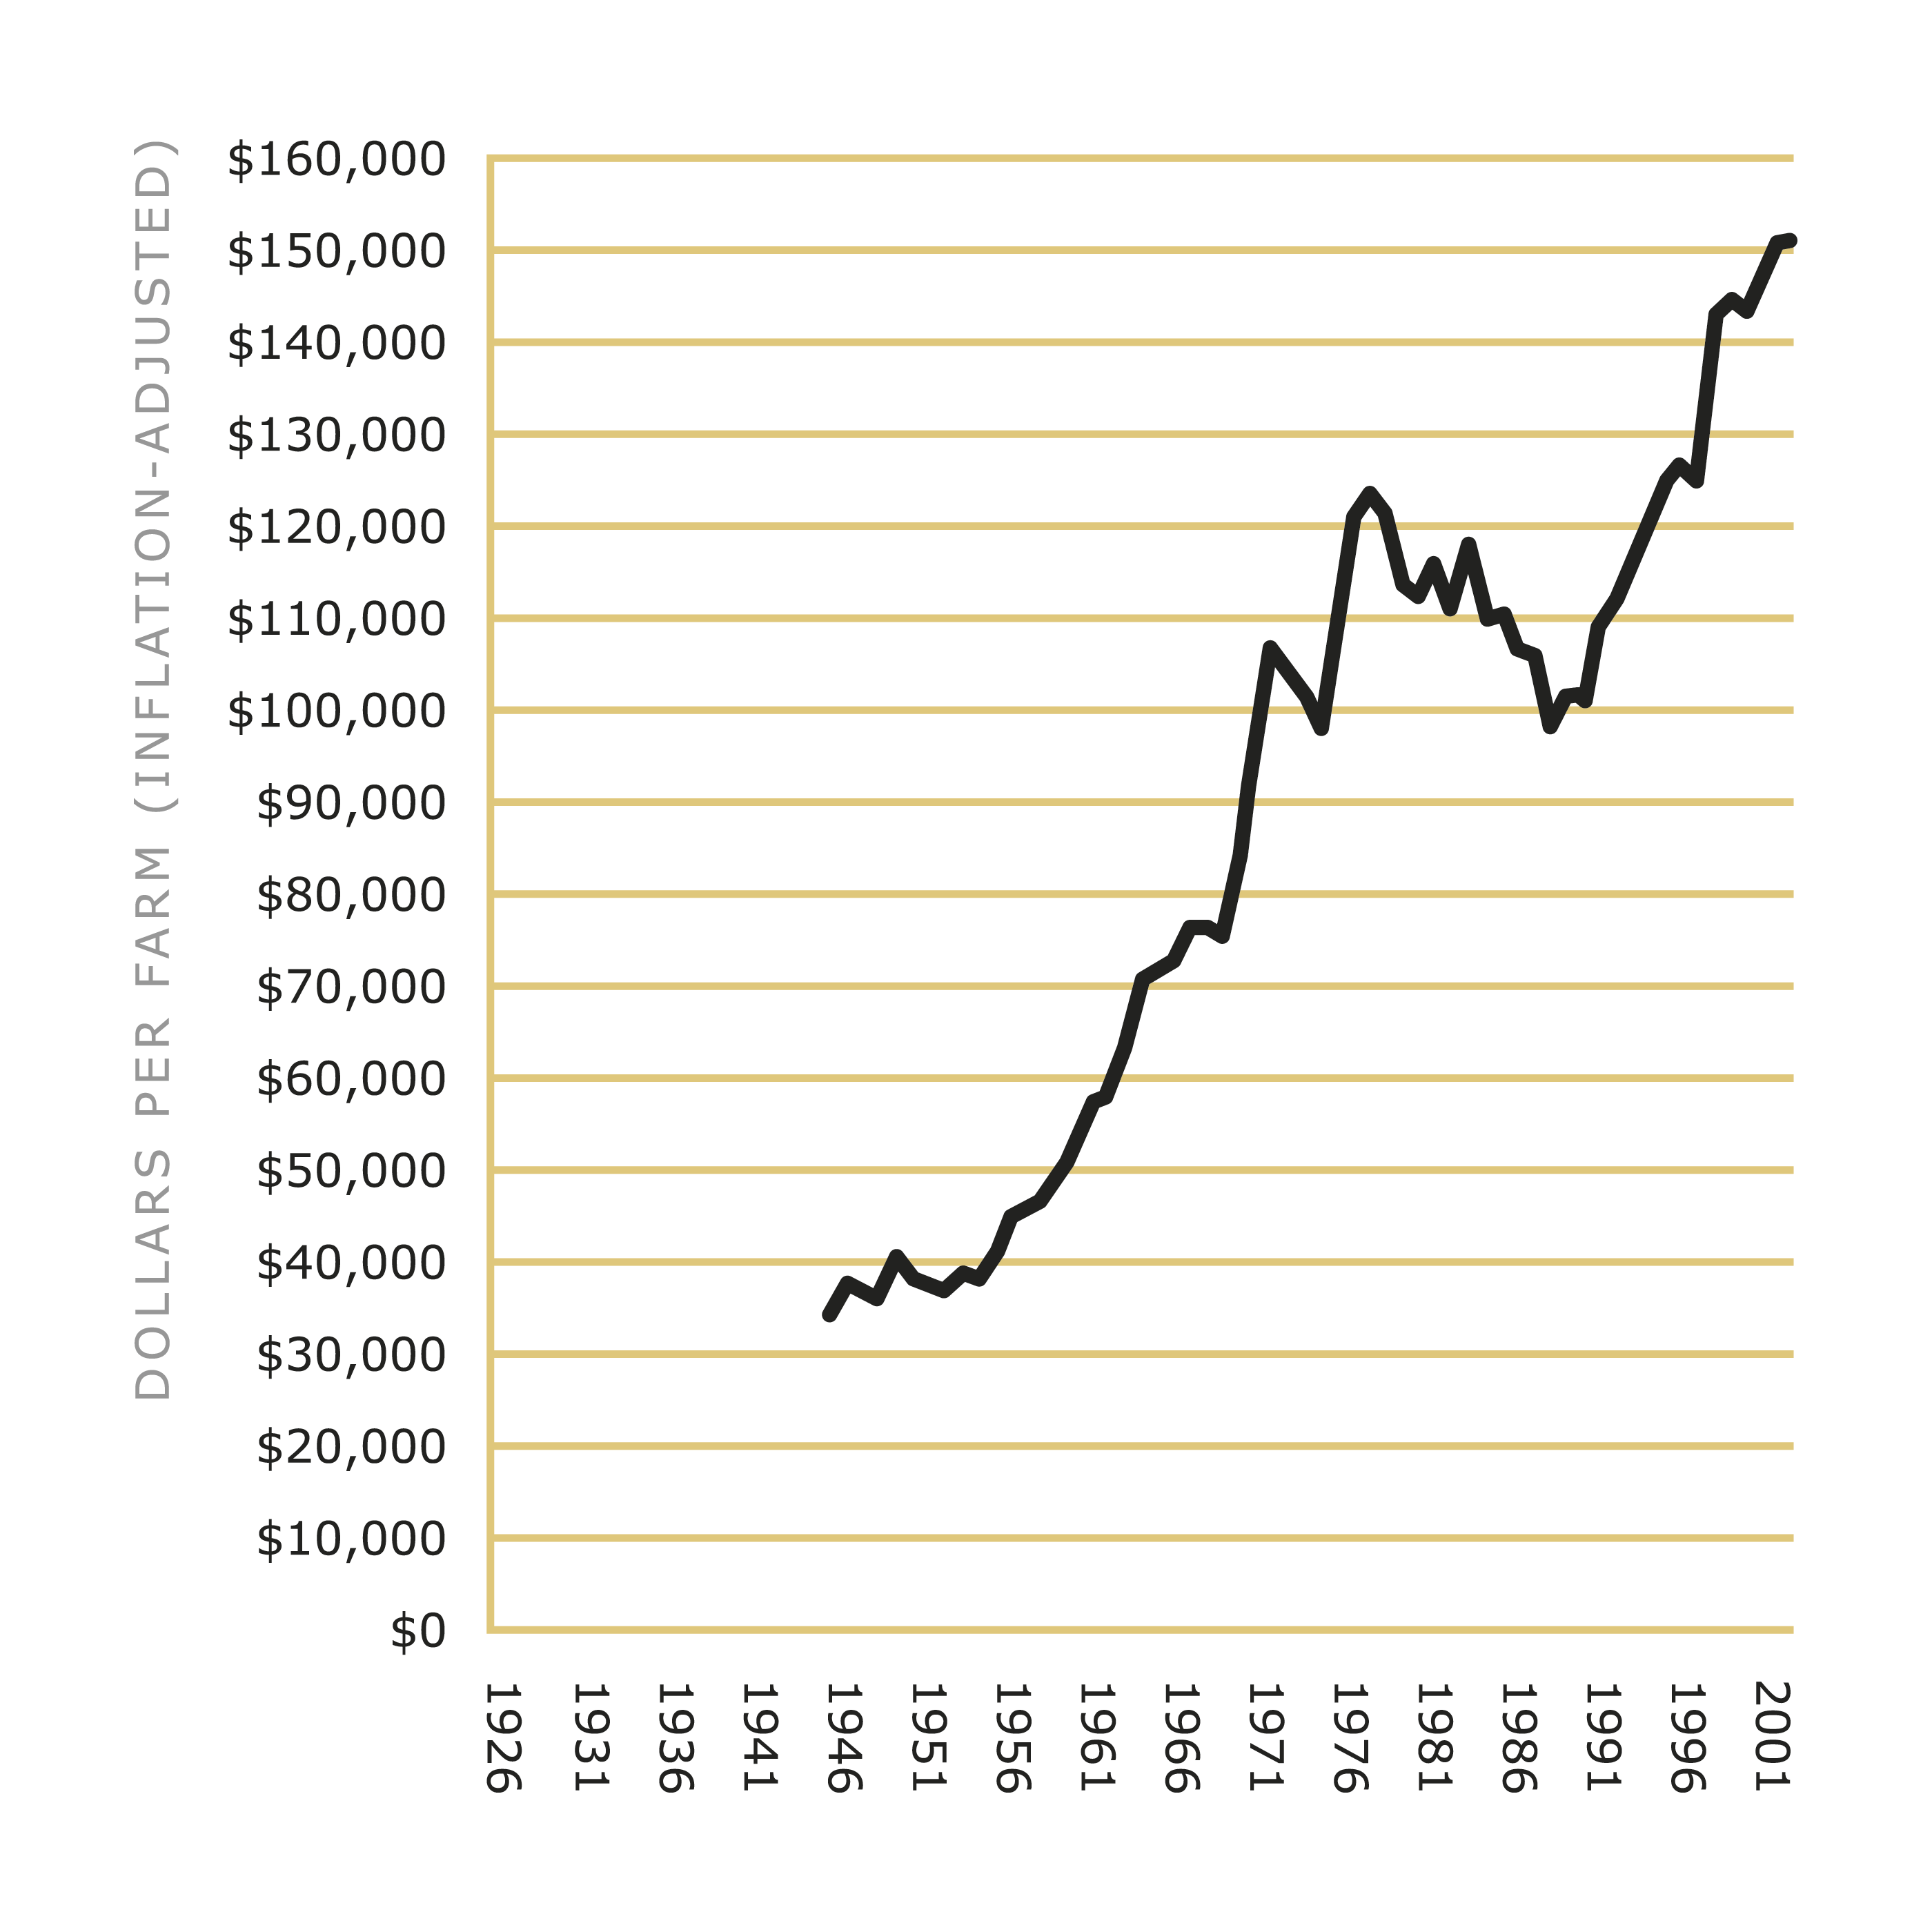
Ontario Gross Farm Revenues, Net of Government
Payments, Per Farm. Source: Statistics Canada. Click for larger image.
However, despite rising production, farmers’ net incomes continue to fall. Graph 2 shows 80 years of Realized Net Incomes from the markets (Market RNI). By subtracting government payments, Market RNI shows the full extent of falling market returns. In effect, by subtracting subsidies and showing just how badly the markets are treating farmers, Market RNI eliminates the masking effect of taxpayer support and highlights the need for real solutions.
Graph 2. Ontario Net Farm Incomes from the Markets 1926-2005
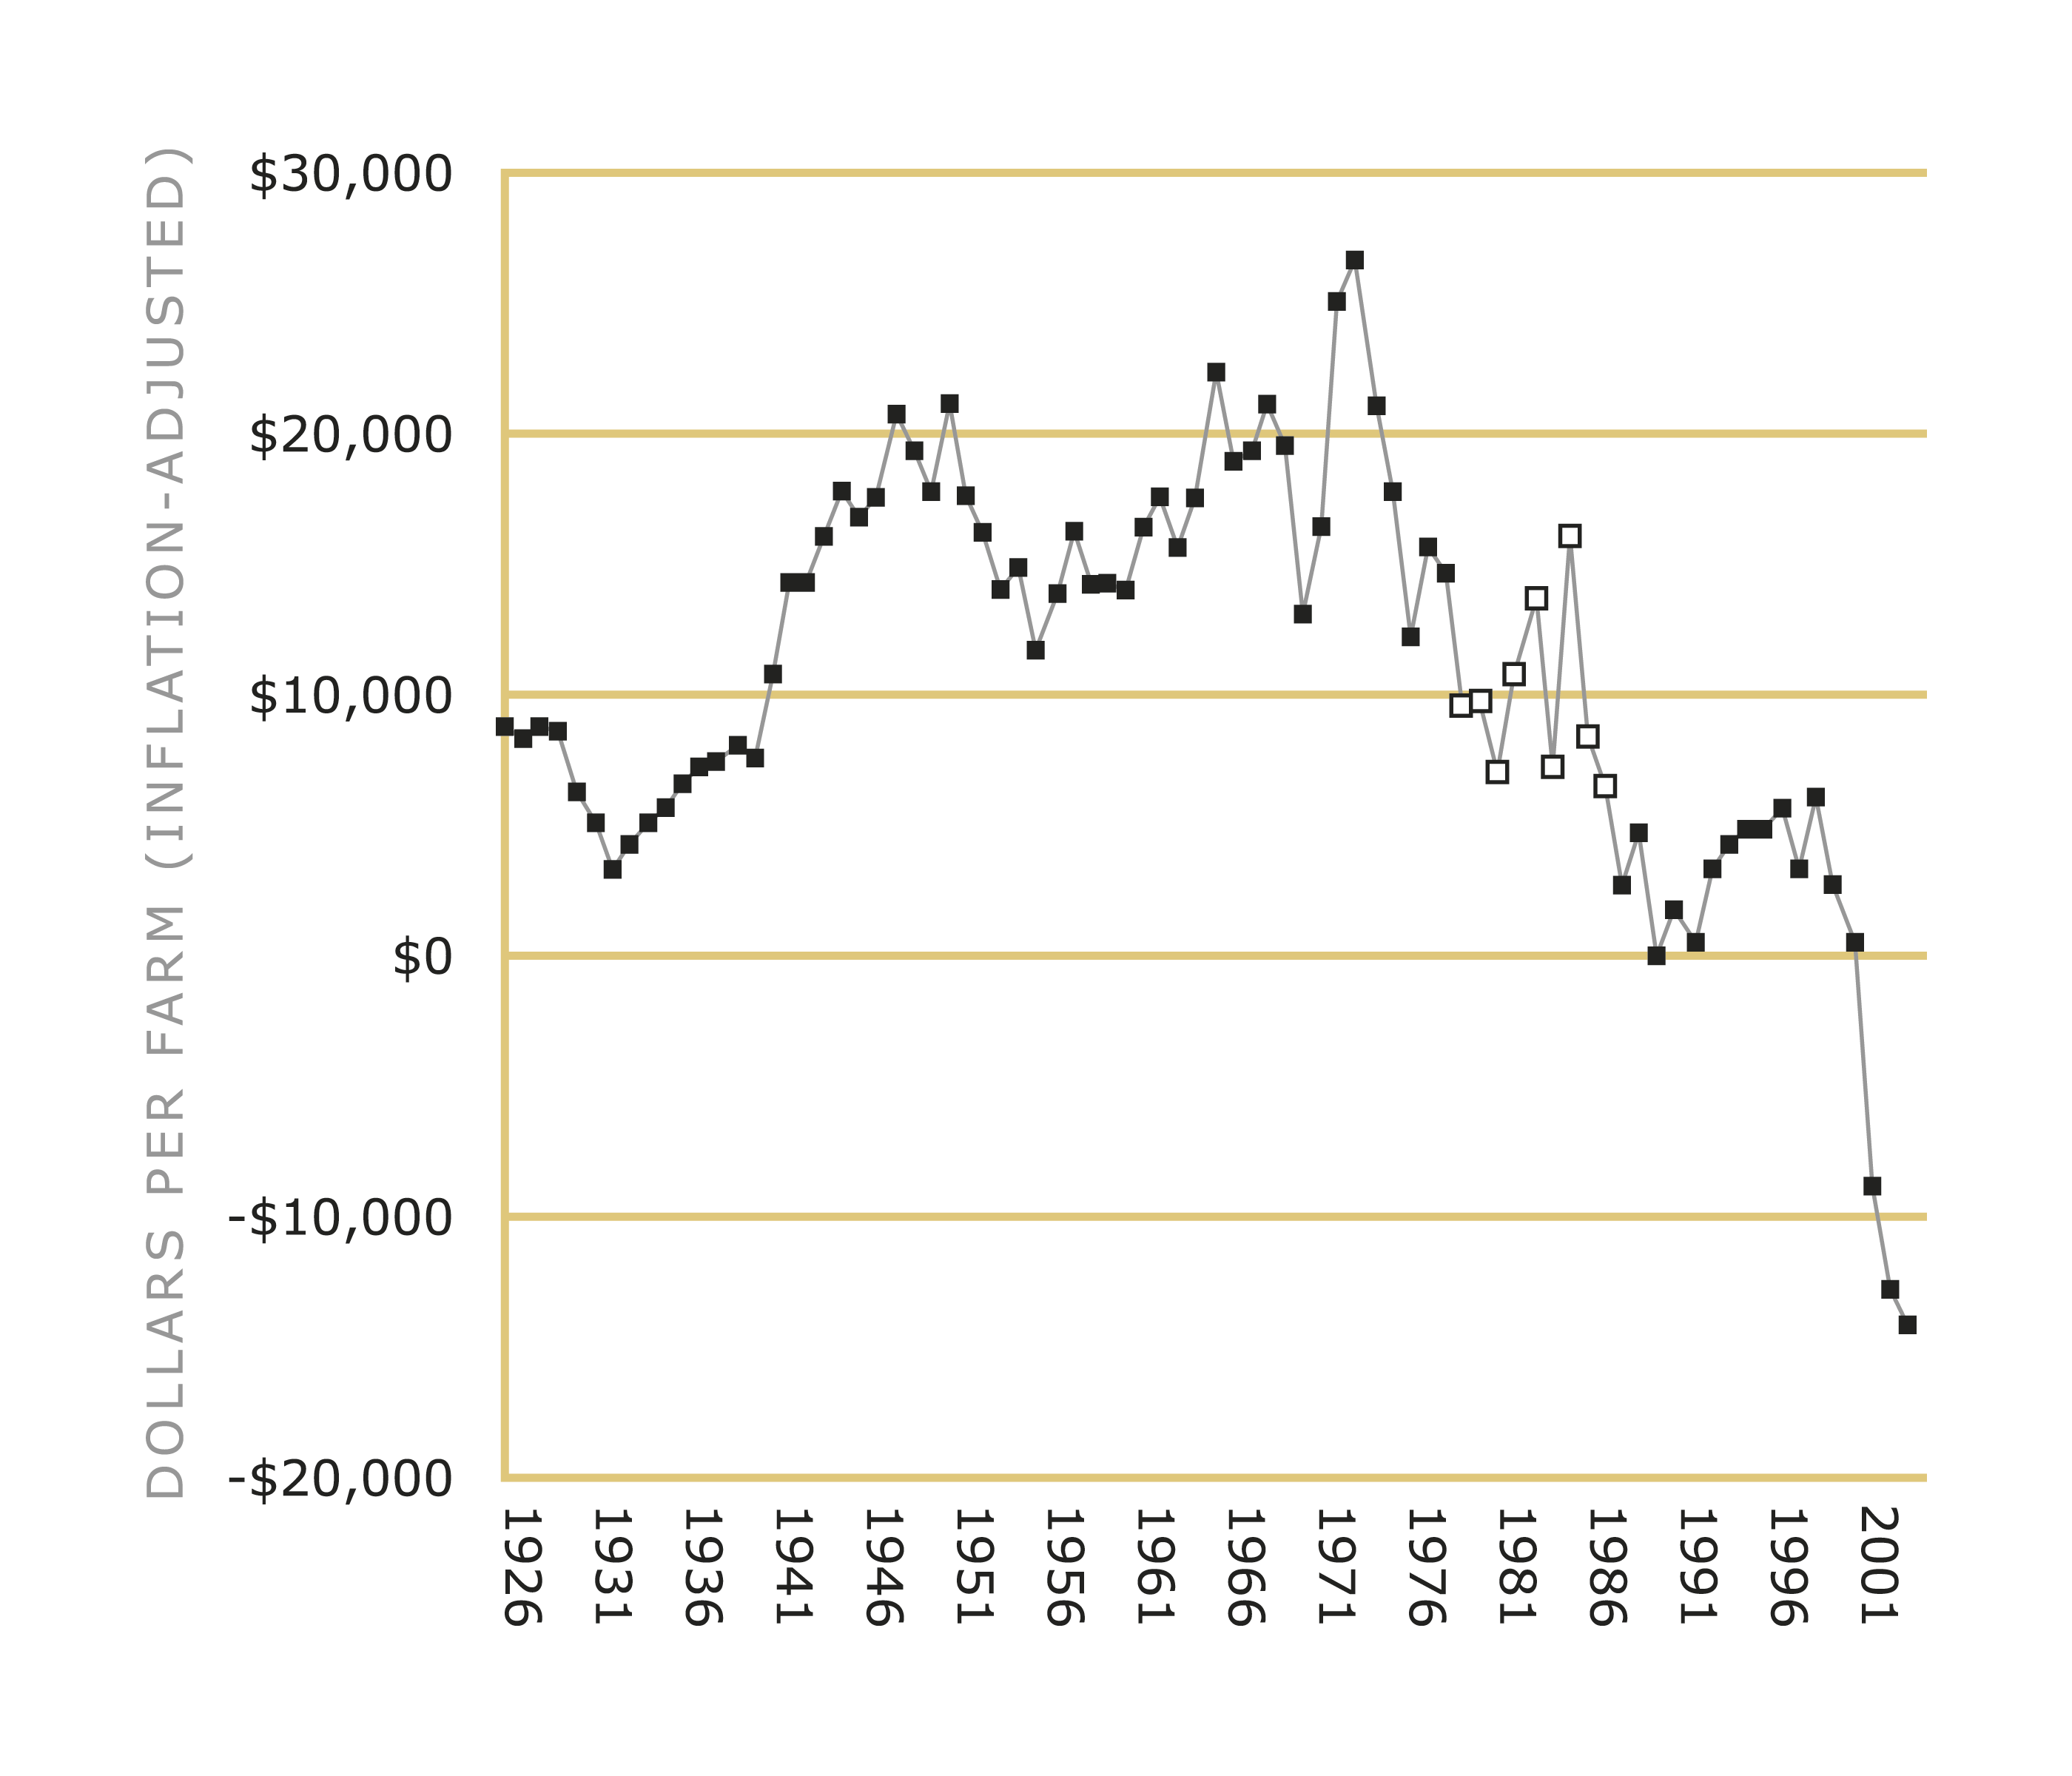
Ontario Realized Net Farm Incomes, Net of Government
Payments, Per Farm. Source: Statistics Canada. Click for larger image.
Graph 2 shows that for nearly 40 years, between 1940 and 1979, never once did Market RNI on an average Ontario farm drop below $10,000; it oscillated between $10,000 and $25,000.
From 1980 to 1988, per-farm Market RNI found a new channel; it oscillated between $6,000 and $16,000 (the white squares in Graph 2).
Since 1989, however, Market RNI has rarely topped $5,000 per farm. And, in the most recent three years, it has remained submerged near negative $10,000 per farm – far below the levels of the Great Depression. Only through off-farm income, government payments, asset sales, and added debt have farm families been able to cling to their land.
The Causes
Table A summarizes the preceding graphs and calculates averages for each of the past five-and-a-half decades. The right-hand column lists per-farm net incomes from the markets. That column shows that Ontario’s farm crisis did not start with any recent drought, price decline, or BSE outbreak. The crisis began in the 1980s when farmers’ net incomes from the markets plummeted. BSE and yet another decline in grain prices have had their effects recently, but they merely intensified a crisis that has been consuming farm families for over two decades.
Table A also shows that in the 1950s and 1960s, farmers’ expenses were low enough that the average farmer could keep, in the form of net income, about $1 for every $3 in revenues. In the 1970s, that farmer could hold onto about $1 for every $5 in revenues. In the 1980s, however, the farmer managed to hold on to $1 in $12. In the 1990s, it was $1 in $36.
Table A. Per-Farm Gross Revenues, Expenses, and Net Incomes
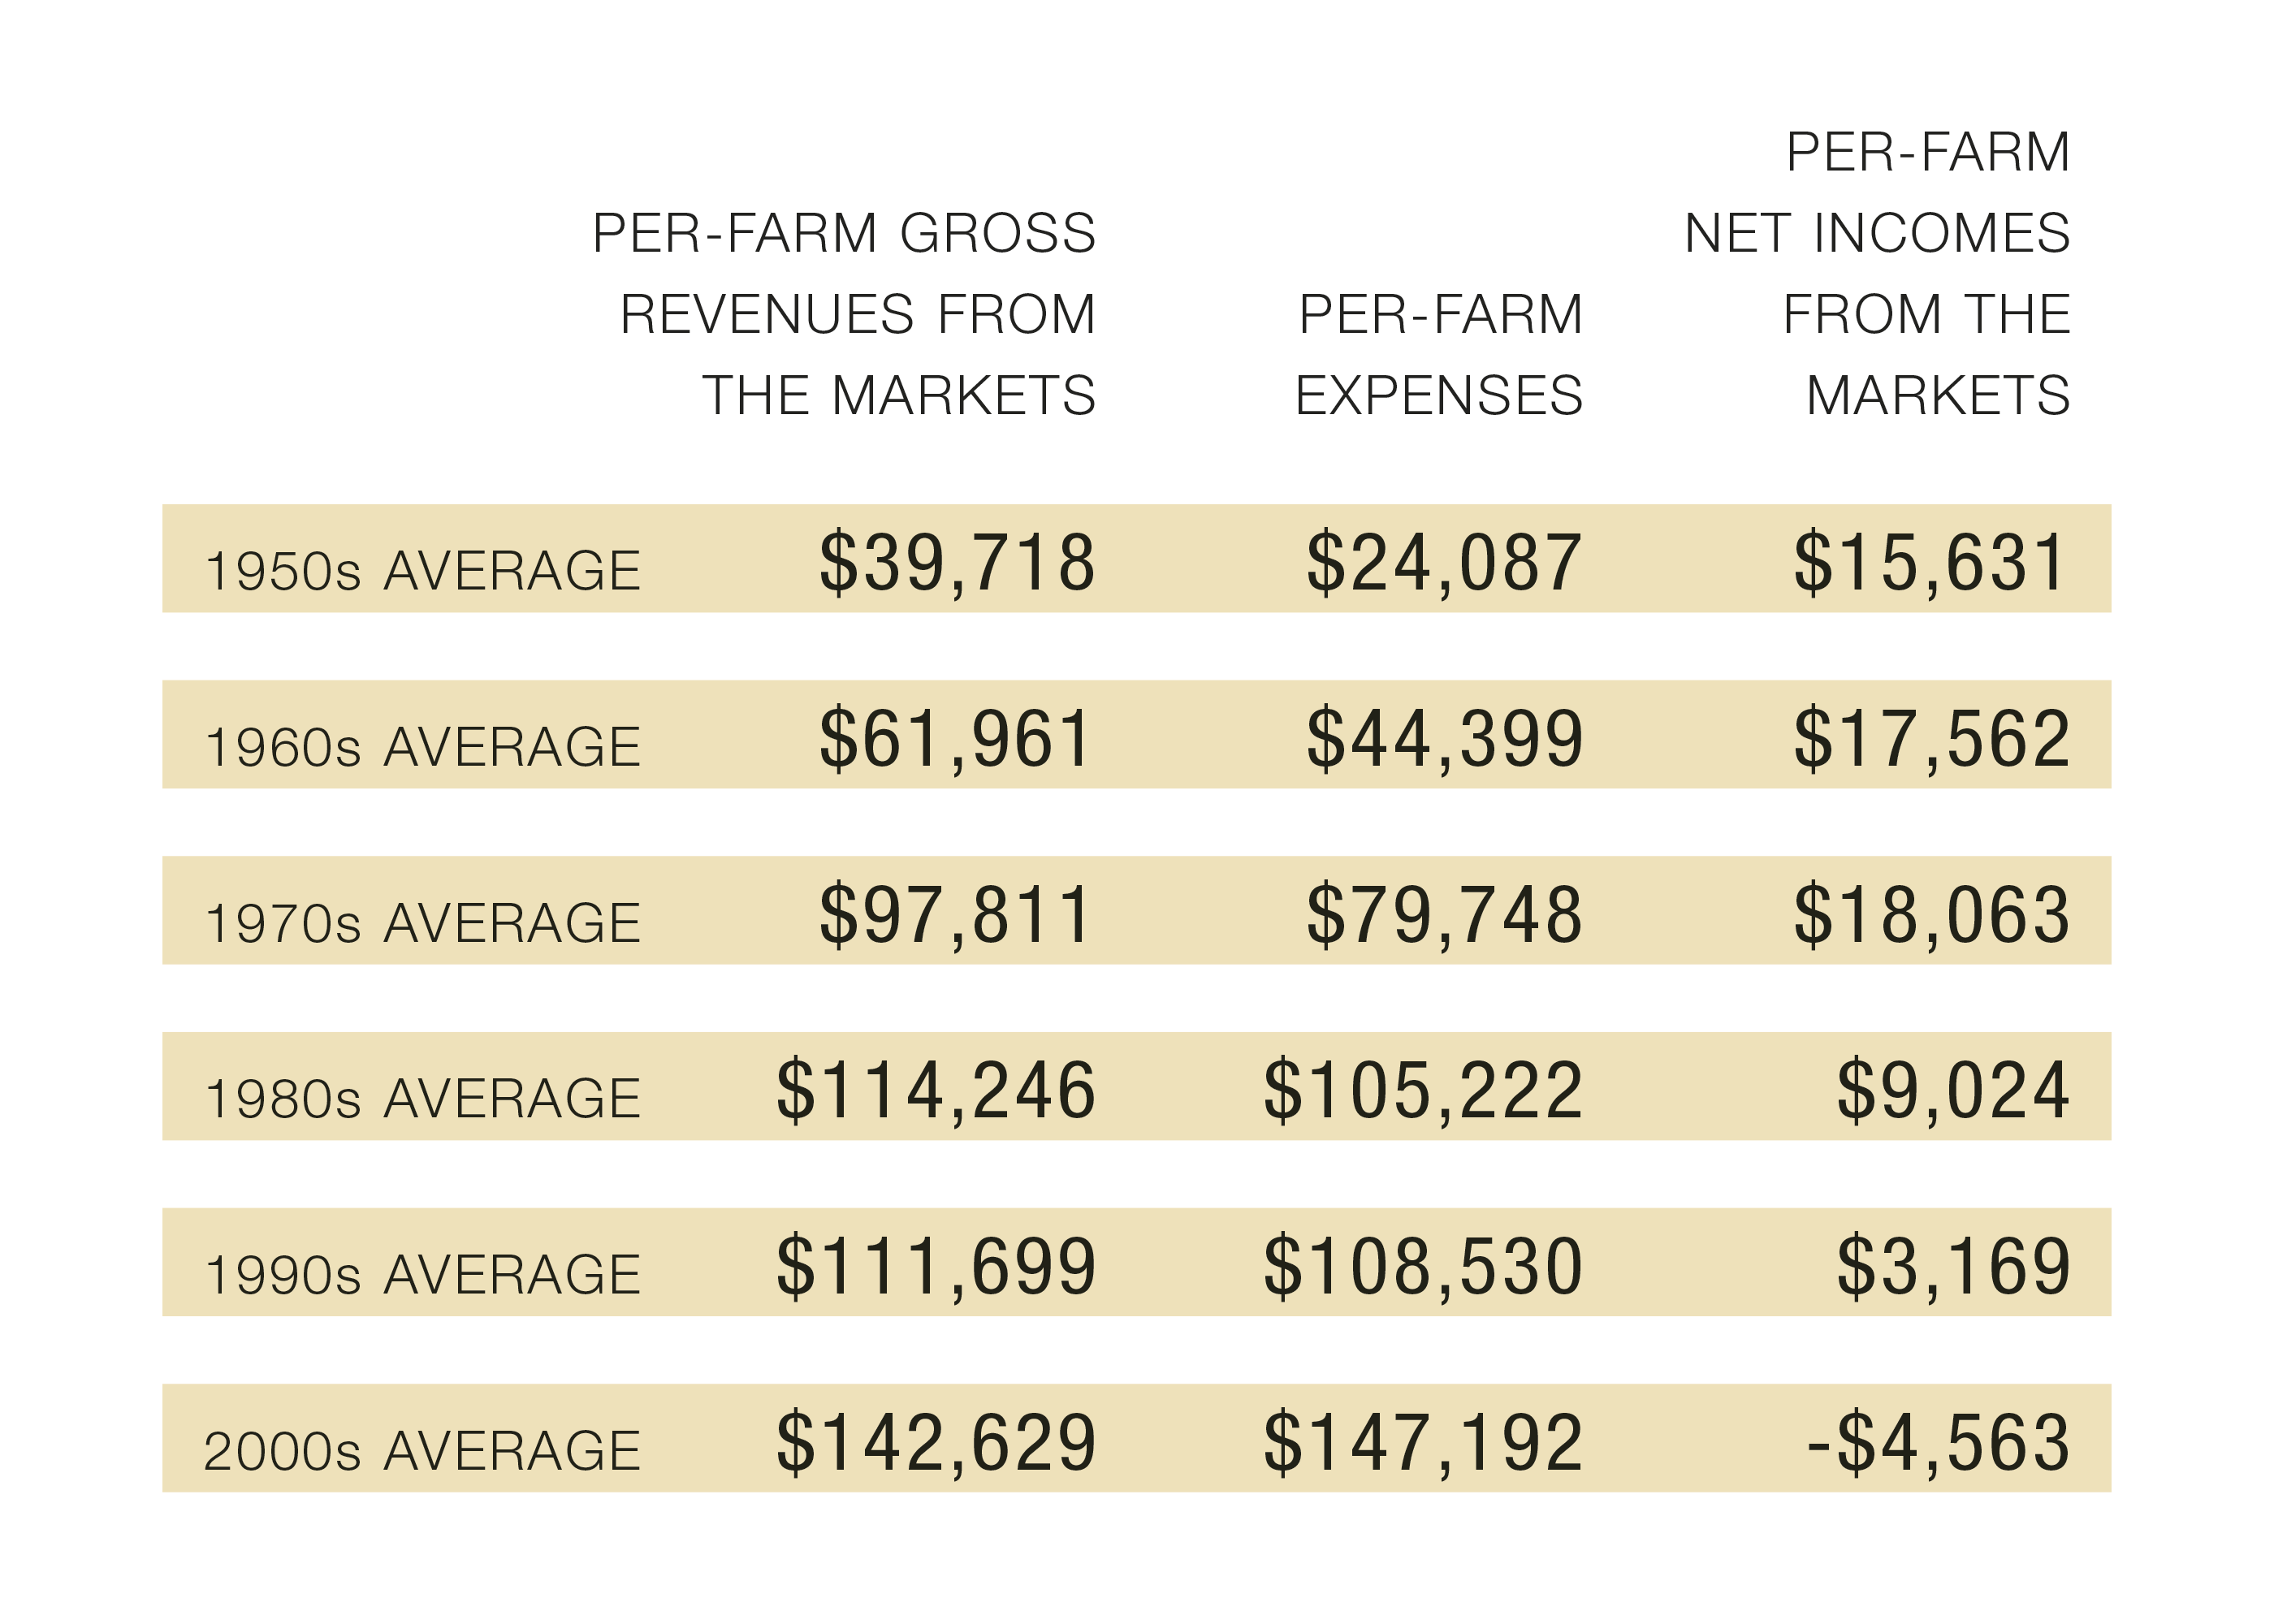
Click for larger image.
So far in this decade, the farmer cannot hang on to a single penny; every dollar he or she earns in revenues, plus more, goes out in expenses, leaving only losses. The middle column in Table A, ‘Per-farm expenses,’ shows that while gross revenues tripled, farmers’ expenses increased six-fold.
So where is all the money going? Part of the answer is in Graph 3. It is taken from the 2001 annual report of Agrium Corporation, a world-leading fertilizer-maker. The title of the chart, ‘Nitrogen Prices Follow Grain Prices,’ confirms what many farmers have long suspected: the correlation between the price that farmers receive for corn and the price that Agrium charges farmers for urea (nitrogen) fertilizer. The price correlations between fertilizer and wheat and between fertilizer and other grains are similar to Graph 3. There is little correlation, however, between the price of fertilizer and the price of natural gas, which is the largest single cost in making nitrogen fertilizer.
Graph 3. Ontario Net Farm Incomes from the Markets 1926-2005
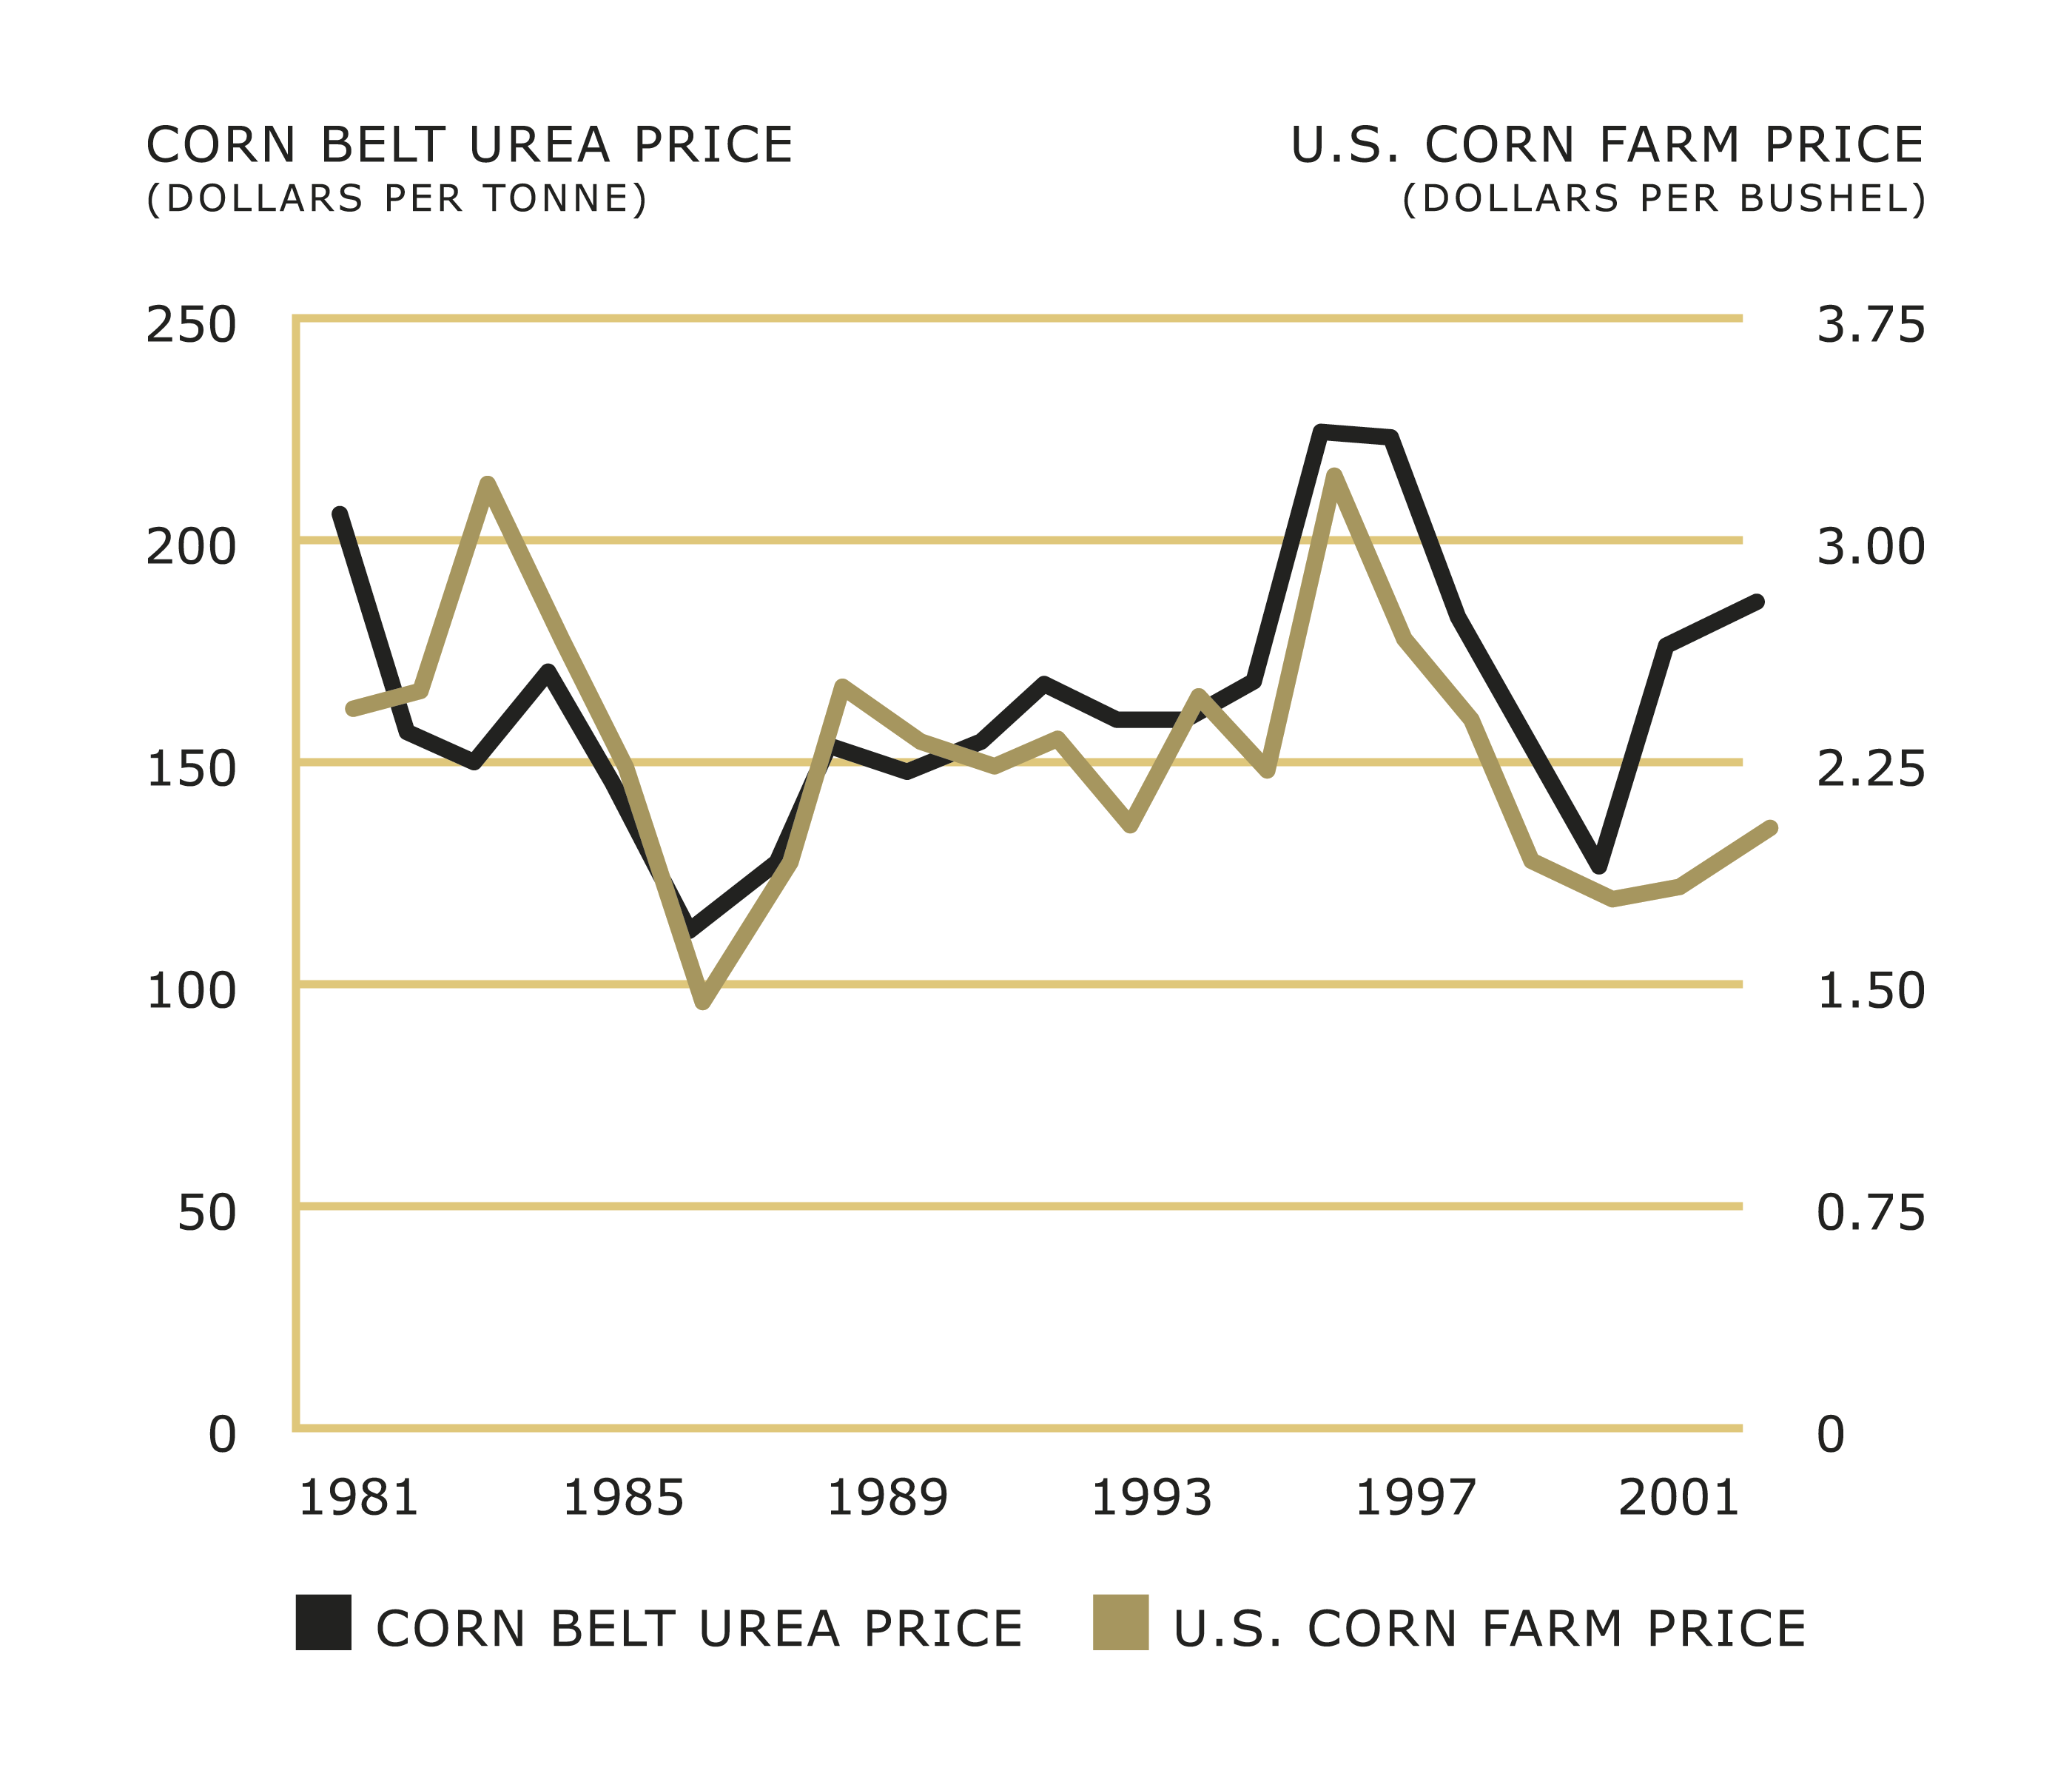
Sources: Green markets, USDA, Blue Johnson, (fertilizer year). Click for larger image.
Agrium’s graph provides one illustration of a pervasive practice: input-makers price according to what the market will bear. When grain or livestock prices rise and farmers have more money, input-makers raise their prices to snatch the extra dollars right out of farmers’ pockets. Such predatory pricing is, of course, impossible in markets where any real level of competition exists to discipline companies. Agrium and two other companies own 85 per cent of Canada’s urea (nitrogen) fertilizer production business.
Agrium is certainly not alone among input-makers, and input-makers are only one part of the problem; processors and retailers use their market power to take revenue and profit dollars that, before the mid-1980s, would have landed on our farms. As U.S. agricultural economist Richard Levins quips: “the shortest possible economic history of…agriculture during the twentieth century would be this: non-farmers learning how to make money from farming.”
Almost as succinctly, one might describe the Ontario farm crisis thus: A customer puts $1.35 on a grocery counter for a loaf of bread. Powerful food retailers, processors, and grain companies take $1.30, leaving the farmer a nickel. Powerful energy, fertilizer, chemical, and machinery companies take six cents out of the farmer’s pocket. Taxpayers return the penny.
The Chain
Our farms are embedded in an agri-food chain that stretches from energy companies at one end; through fertilizer, chemical and machinery companies; through farmers, in the middle; and on to include grain companies, packers, processors, retailers and restaurants.
Two things are evident about this chain. First, every link in the agri-food chain is dominated by a tiny number of huge corporations: except the farm link. And, with every passing year, the number of companies at each non-farm link gets smaller and the companies get bigger.
Some examples: Just weeks ago, Cargill Corporation – which already controls 30 per cent of Canadian beef-packing capacity – announced it will purchase Ontario-based Better Beef. With that purchase and Cargill’s expansion at its Alberta plant, the company will control approximately 50 per cent of the country’s beef-packing capacity. And just two companies, Cargill and U.S.-based ‘protein giant’ Tyson, will control approximately 80 per cent of capacity.
The situation is similar at the other links. In the late 1980s, there were six major machinery companies in Canada – not many, but mergers have now left only three (CNH, for instance, is an amalgam of Case, New Holland, Inter-national Harvester, Ford, Fiat, Steiger and others). Three companies produce most of our fertilizer; six make most of our chemicals; four mill our flour; six control food retail. While governments and the media talk about free trade and free markets, farmers increasingly face near-monopolies.
The second thing that is evident about the agri-food chain is that every link is characterized by large profits: except the farm link. There is a strong correlation between market power and profitability. In the current environment, farmers lack both.
Canadians spent over $100 billion last year for food in grocery stores and restaurants. In addition, we export tens of billions of dollars worth of food to foreign customers. The agri-food chain is awash with billions of dollars in profits. But those profits are captured at other links, leaving farmers with large losses.
When we view the agri-food chain in its entirety and see that profit is the norm, we are struck by the deep and grinding crisis confined to the farm link. The fertilizer and seed companies, packers and processors, grocery stores and fast-food franchises that make up the rest of the chain are not in similar crisis. Farmers are suffering even as these other players’ profits grow.
The farm income crisis is caused by an imbalance in market power that creates a parallel imbalance in the allocation of the profits in the agri-food chain. While production levels, crop selection, export level, efficiency, local regulations, and technology adoption may affect farmers’ gross revenues, farmers’ net incomes will be determined by their relative market power, by their ability to wrestle their fair share of profits out of the hands of the huge corporations that now dominate the other links of our food chain. To a significant extent, the farm crisis is a result of our family farms failing to win those battles.
Government’s Role
There is a second half to the explanation of the causes behind the farm crisis: government policies. Our governments have pursued free-trade, free-market and corporate-deregulation policies that have reduced farmers’ power at the very same time that our corporate buyers and suppliers were busy merging to increase their power and profit.
For farmers, the main effect of these policies is to force the world’s one billion farmers into a single, highly competitive market. Ontario soybean farmers are now part of a seamless global market that pits their soybean oil against canola, palm, cottonseed, olive and fish oils.
Trade agreements have increased the level of competition that farmers face, at the same time as they have predictably decreased farmers’ prices and profits. However, these agreements have not had the same negative effects on agribusiness corporations; these companies have taken advantage of globalization to merge, thereby reducing their competition and increasing their prices and profits.
Complementary to their free-trade policies, Canadian federal and provincial governments have pushed farmers to expand production for export. However, the push to expand exports has left farmers vulnerable. Cattle farmers, for example, continue to face a closed border as a result of BSE, and hog farmers face repeated threats of tariffs. Over the past decade, as Ontario agricultural exports doubled, net farm incomes tumbled.
The list of farm sectors most dependent on exports – grains, oilseeds, hogs and cattle – is the same list of sectors that have been hit hardest by the farm crisis. On the other hand, the list of sectors that produce primarily for the Canadian domestic market – dairy, egg and poultry producers – shows farmers relatively unscathed by the farm crisis.
Governments, in response to the dictates of trade agreements and market ideology, have terminated many of the programs that have helped farmers. Examples include the Two Price Wheat program; Tripartite Stabilization on hogs, cattle, and other livestock; and hog marketing boards in several provinces.
Finally, Canadian governments, by pursuing economic integration and failing to enforce competition policies or restrain mergers, have accelerated the foreign takeover of our food-processing sector, leaving farmers to bargain with larger, more distant companies.
Before the first Canada-U.S. free-trade agreement in 1988, ownership of our flour mills was widely dispersed and Canadians owned 50 per cent of our milling capacity. By 2002, Canadians owned just 21 per cent of capacity. One U.S. company, Archer Daniels Midland, owned almost half. Similarly, Canadian ownership of plants that produce barley malt (the key ingredient in beer) fell from 95 per cent in 1988 to 12 per cent in 2002.
The Future
Ontario shoe stores, clothing stores, movie theatres, confectioneries and grocery stores used to be owned by local families. Over the past 50 years, the local families have been pushed out of nearly every sector of the economy – replaced by big box stores, chains, and franchises. The only sector of the Ontario economy where local families still hold significant ownership and control is the farm sector. But as the last holdouts, those farms are besieged.
The question of whether local families can hold onto their farms has implications for our economy, our environment, and for the future of our democracy. Ontario farmers, citizens, and governments, like those around the world, will need to act decisively if we are to retain this one last sector under local family control.
The first step to safeguarding our family farms against this global crisis is cutting through the myths and mis-understandings that surround the crisis and having the courage to speak honestly about its causes.
More Info
‘Net Income’ ≠ ‘Profit’
Realized Net Income (RNI) is not the same as profit. Corporate profit is calculated after every employee is paid: CEO to secretary. But measures of net farm income are calculated before allowances are made for farm family labour and management. Out of RNI, farm family members must pay themselves and cover certain other expenses such as land principle repayment.
Farm Crisis Myths
Myths about the causes of the farm crisis abound. Here is a selection.
Myth: Oversupply is the problem.
Facts: The world grain stocks/use ratio – the most oft-quoted measure of supply and demand – touched a 30-year low in 2004. In four of the last five years, globally, we ate more grain than we grew. Other food sources, such as fish, are in decline. World cropland area per capita continues to decline. As energy prices rise, it will be hard to maintain global food production.
Although Ontario and the rest of Canada produce a lot of food, each year global population growth adds the equivalent of two-and-a-half Canadas. Over the next six years, we will add to the world’s population the equivalent of another North America. Over the next 15 to 20 years, we will add the equivalent of another India or China, and over the next 40 years, the equivalent of an India and a China.
Myth: Farmers are inefficient.
Facts: For over 40 years, farmers have posted the highest efficiency gains of any sector in the Canadian economy. Farmers today produce and sell for 1970s prices, a feat unmatched by Coke, Nike, GM, Kraft, or Shell. While the number of farmers fell by 12 per cent in the latter half of the ’90s, the number of accountants and admen rose by 18 per cent and 25 per cent respectively.
Myth: The crisis is caused by US and EU subsidies.
Facts: The argument that subsidies cause increased production, oversupply and falling prices is false. There is no correlation between subsidy levels and production increases. And there is no oversupply. A recent study by US agricultural economist Daryll Ray found that even if we could magically terminate all subsidies tomorrow, grain prices would hardly move. Ray’s model showed a 3 per cent increase in corn prices as a result of the end of subsidies.
Myth: A rising dollar is to blame.
Facts: The rising Canadian dollar has not created the global farm crisis. In the 1970s, when the Canadian dollar was at its peak, Canadian farmers prospered.
Related Stories
The Farm Crisis: Local Solutions
Although food prices have risen in recent years, farmers haven’t received their fair share of the increase.

Seize the Local Moment
We’re lucky to live in a farm region that cares so much about food and that is embracing new opportunities in food education and ecoliteracy.